With datasets growing larger every year, a useful tool to process mountains of information quickly is Streamlit. In this post, we aim to guide you through the setup process for both Python and Streamlit, as well as walk you through the process of creating your first visual representations of data to showcase the processing power of Streamlit. This guide takes elements from the official documentation of Install Streamlit using command line — Streamlit Docs and code.visualstudio.com.
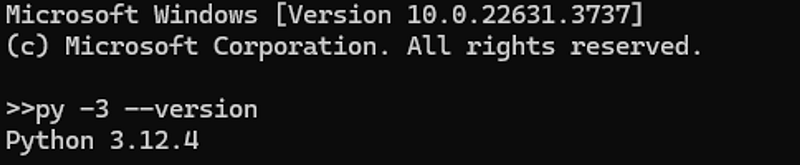
Setting up Python in Windows is fairly simple. Windows should already have a version of Python installed, meaning existing Python code can be run. However, to setup Python in an IDE such as Visual Studio Code, there are a few additional steps to take. Firstly, download and install the latest official release of Python from python.org. This will setup the libraries and localized files needed. The installation can be verified within a command prompt by running the command "py -3 — version" for Windows, or "python3 — version" for Linux and macOS. The command prompt will detect the installed Python files and return the current version of Python installed as seen in the image below.
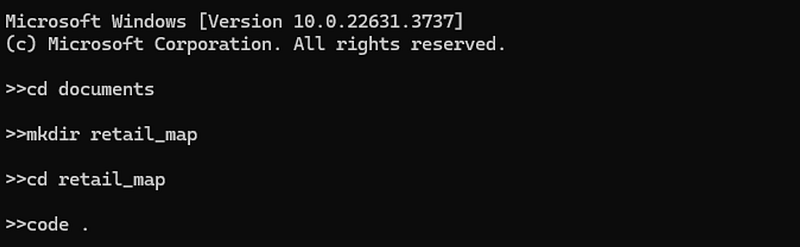
After verifying the Python installation, the next step is to configure the environment in VS Code. Install VS Code for your operating system, then create an empty folder to use as the workspace. This can be done in the local file manager, or through the command prompt as shown in the image below. The command "cd" allows you to change your current file path, while "mkdir" creates a directory or folder. The final line "code ." launches VS Code in the current file path.
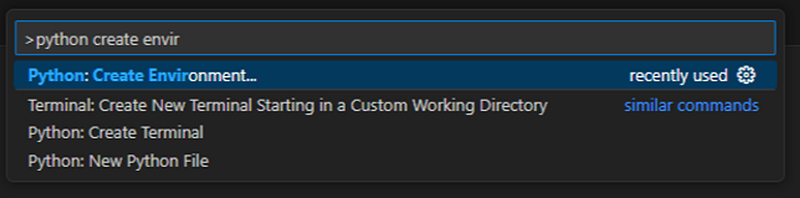
To configure VS Code, start by showing all commands using the shortcut "Ctrl+Shift+P". In the menu that opens, select the option "Python: Create Environment". As the command list is fairly long, you can also type out the command to filter the options.
Once selected, the command menu presents a choice of a Venv or Conda environment. Choose Venv.

The recently installed Python version should be available to select in the next menu. After clicking on it, the environment should be configured by VS Code. The progress will be shown in a popup box, followed by another box showing the current environment.
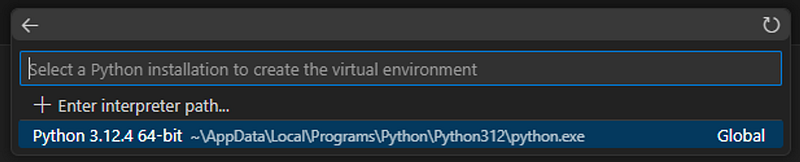
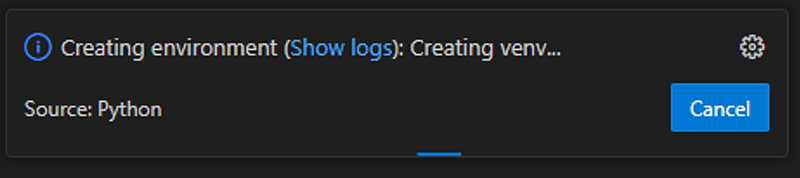

Finally, to be certain that the current environment is the one displayed in the above box, or to switch environments as needed, use the command "Python: Select Interpreter" from the command list following the shortcut listed above.
Setting up Streamlit
To setup Streamlit within VS Code, open the command list with the same shortcut used above. Select "Python: Create Terminal". In the bottom right corner of the screen, open the dropdown menu of the "+" symbol and select command prompt. This will create a command prompt terminal in the current file path within VS Code.
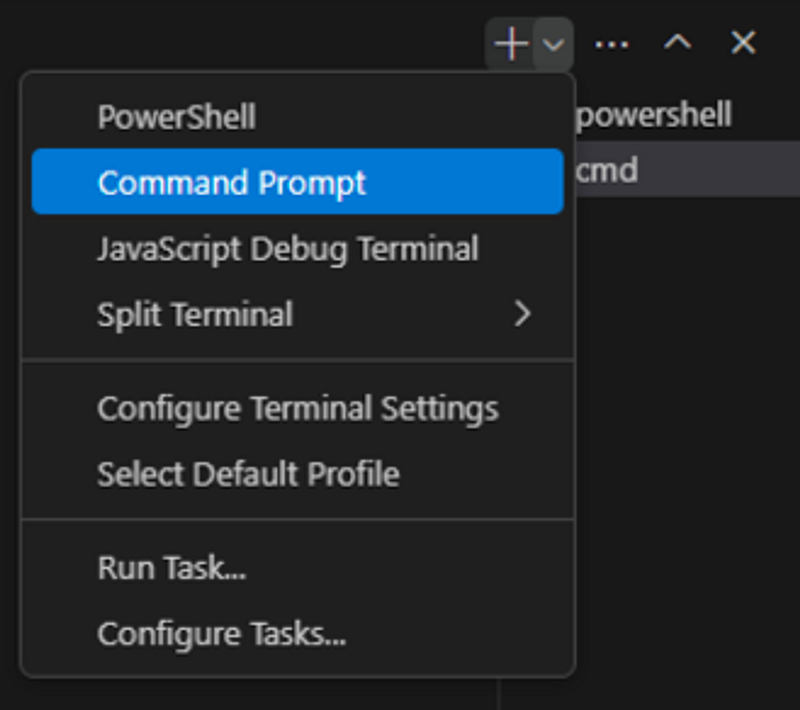
Within the new command prompt, run ".venv\Scripts\activate.bat" to initialize .venv commands. Finally, run "pip install streamlit" to download and configure streamlit within the current environment. The command prompt should display messages of the operations performed collecting various Streamlit files and installing them.

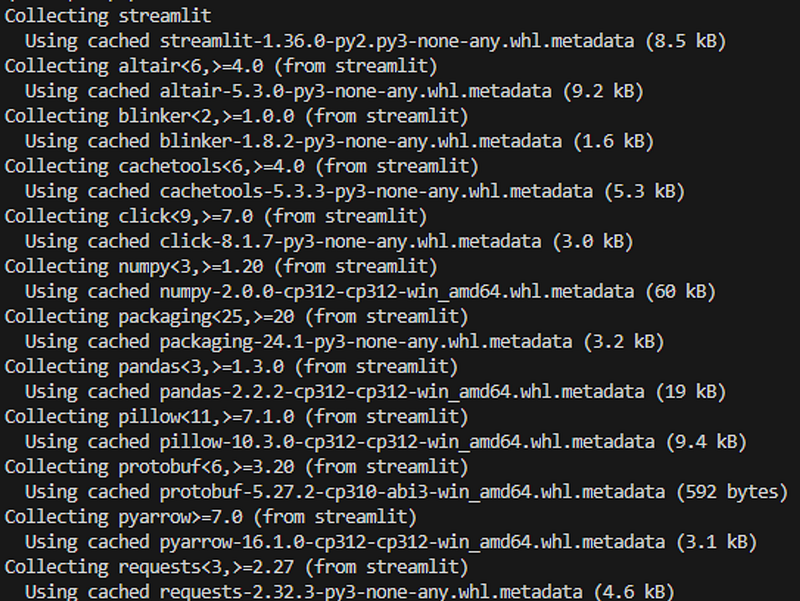
Streamlit is now ready to be used! For this map visual, also run "pip install pandas", "pip install geopandas", and "pip install plotly.express".
First Map Visual
To begin creating your first map visual, first create a python file. This can be done in the file viewer within VS Code. Click the new file icon and name the file "retail_map.py".
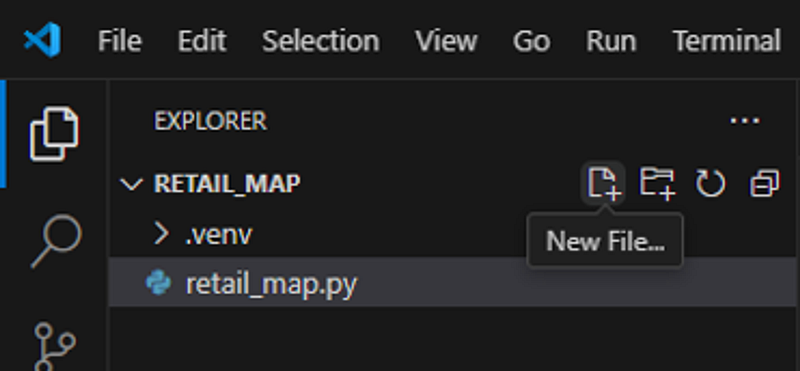
Within that file, first import the libraries to be used. Assign them a name to be called whenever a function is used as below.
import streamlit as st
import pandas as pd
import plotly.express as px
For this visual, we will use a public sample dataset from our website (originally from Kaggle but edited to reflect this walkthrough). Follow the link here to download this dataset and follow along: Superstore Sales. Download the file and move the csv file to your environment folder location.
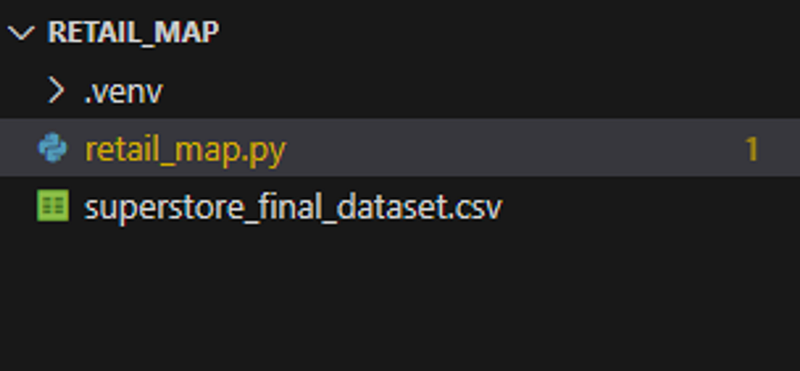
Now load the data from the csv file into a variable.
#Load CSV data
df = pd.read_csv('superstore_final_dataset.csv', encoding='windows-1252')
Next we'll create a filtering dropdown menu to filter data by years. Follow the code in the image below to implement it.
# Convert 'date' to datetime, change format and extract year for filtering
df['date'] = pd.to_datetime(df['Order_Date'], format="%d/%m/%Y")
df['year'] = df['date'].dt.year

# Year selection
year_list = sorted(df['year'].unique())
selected_year = st.selectbox('Select a year', year_list)

# Filter data for the selected year
df_filtered = df[df['year'] == selected_year]
Finally, we can create a visual map of the USA and the states reflecting sales data for the selected year using a choropleth map as a part of the plotly.express library. Follow the image below to implement this, having locations = the new abbreviated state column header.
# Streamlit UI
st.title('Retail Sales Over Time')
st.write(df_filtered)

#Create USA map
figure1 = px.choropleth(df_filtered,
                      locations=" State_Abb",
                      locationmode="USA-states",
                      color="Sales",
                      color_continuous_scale="YlOrRd",
                      range_color=(0, 1700),
                      scope = "usa",
                      hover_name="State"
                    )

st.plotly_chart(figure1)
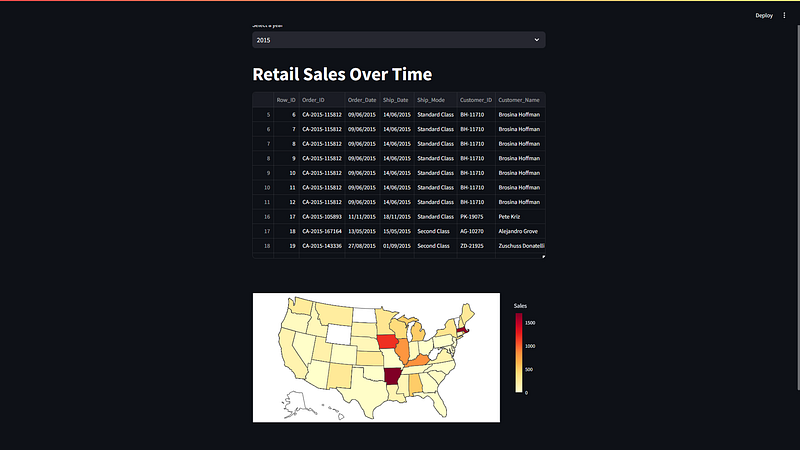
To generate the final page, click run, then type the command generated for streamlit in the command window. It will be similar to "streamlit run ~/retail_map.py", where ~ is your personal PC environment path. The resulting page should appear as below.
Conclusion
As shown through the process above, with the correctly formatted data, Streamlit can take csv files and turn them into vibrant visual maps to quickly see large amounts of important data in a concise view. It can also filter and transform data flexibly. Instead of filtering by year, we could have easily filtered by state and had a graph of sales by state across multiple years. Streamlit remains a power tool to quickly organize and transform large datasets into easily digested pieces of information.