In today's data-driven world, businesses rely heavily on Business Intelligence (BI) platforms to make informed decisions. Among the myriad of options available, Sigma Computing stands out for its unique approach to data analysis and visualization.
Designed with both technical and non-technical users in mind, Sigma Computing offers a user-friendly interface, powerful features, and seamless integration capabilities that make it a compelling choice for organizations of all sizes.
Sigma Computing is revolutionizing the way businesses handle their data by providing a platform that combines the ease of use of a spreadsheet with the power of a BI tool. This post will delve into the basic concepts of Sigma Computing, compare it to other BI platforms, and explore a practical use case of creating a Profit and Loss (P&L) dashboard.
Why Sigma Computing?
User-Friendly Interface:
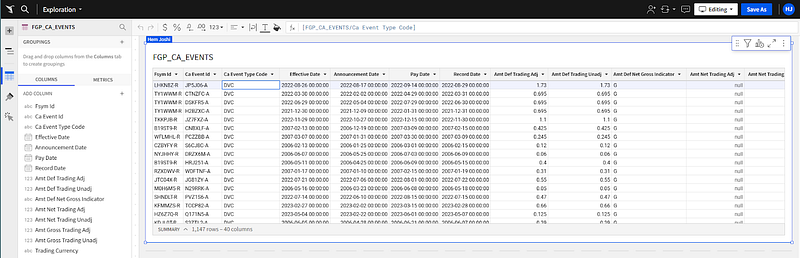
Sigma Computing's interface is designed to resemble a spreadsheet, which makes it intuitive for users who are already familiar with tools like Excel. This reduces the learning curve and allows users to quickly get started with data analysis.
Collaboration Features:
Real-time collaboration is one of Sigma Computing's standout features. Multiple users can work on the same dataset simultaneously, making it easier to share insights and work together on projects.
Data Connectivity:
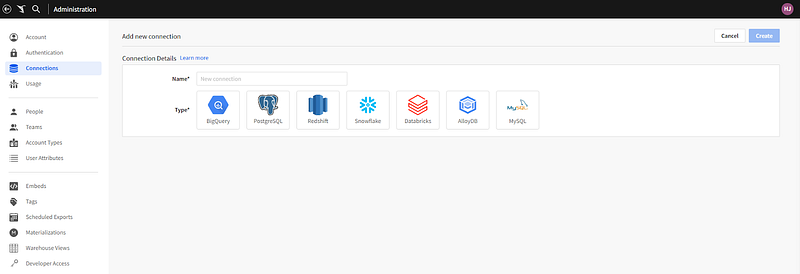
Sigma Computing can connect to a variety of data sources, including cloud data warehouses like Snowflake, BigQuery, and Redshift. This flexibility ensures that users can access and analyze data from multiple sources within a single platform.
Security:
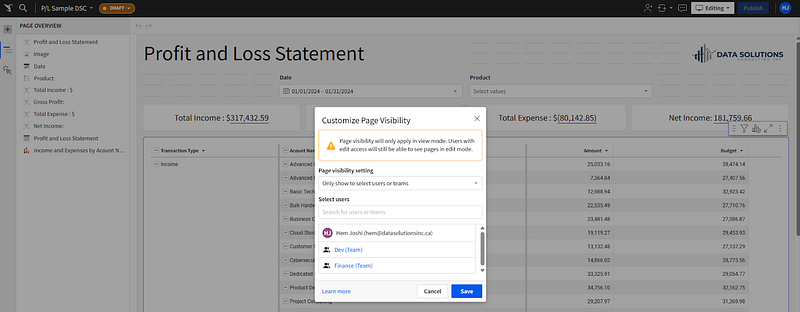
Security is a critical concern for any BI platform, and Sigma Computing addresses this with enterprise-level security features, including role-based access controls, data encryption, and compliance with industry standards.
Key Features and Benefits of Sigma Computing Over Other BI Platforms
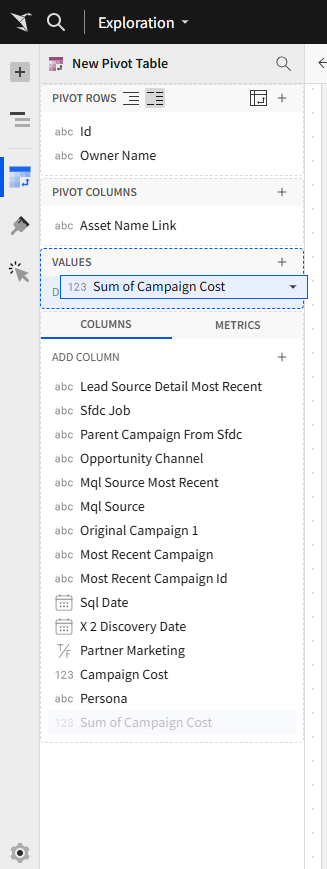
No-Code and Low-Code Options:
Sigma Computing empowers both technical and non-technical users to create complex reports and dashboards without needing to write code. For more advanced users, Sigma provides the flexibility to use SQL to customize and fine-tune their analyses, ensuring that the platform caters to all levels of expertise. With Sigma's no-code options, users can quickly transform raw data into actionable insights, streamlining the process of data analysis. This feature is particularly valuable for businesses that want to democratize data access and empower their entire workforce to make data-driven decisions.
The simplicity of Sigma's interface doesn't come at the expense of functionality. Users can create complex analyses and visualizations without needing to learn a new programming language or interface, making it a powerful yet accessible tool for all team members.
Scalability and Real-Time Data Handling:
Sigma Computing's cloud-based infrastructure ensures that it can handle large volumes of data and concurrent users without compromising performance. Designed to grow with your business, Sigma allows you to add more users and data sources as needed. Its ability to manage and analyze large datasets in real-time sets it apart from batch processing tools, ensuring users always have access to the most up-to-date information. This is crucial for making timely decisions and monitoring performance, tracking key metrics, and responding to changes as they happen.
Sigma's real-time capabilities are particularly beneficial for industries that rely on immediate data insights, such as finance, retail, and logistics. By providing consistent performance and reliability as data needs evolve, Sigma Computing ensures businesses can stay agile and responsive in a fast-paced environment.
Integration Capabilities:
Sigma Computing integrates seamlessly with various tools and platforms, making it easier to incorporate into your existing tech stack. This includes integrations with various data warehouses as mentioned earlier in this blog, as well as cloud storage solutions like AWS S3 and Google Cloud Storage. Additionally, Sigma supports connections to popular BI tools and other third-party applications.
These integrations allow users to leverage their existing data infrastructure and enhance their analytics capabilities. By connecting to multiple data sources, Sigma provides a comprehensive view of your data, enabling more informed decision-making and deeper insights.
Cost-Effectiveness:
Sigma Computing offers competitive pricing models that can result in significant cost savings, especially for organizations that require robust data analysis capabilities without the high costs associated with traditional BI tools. Sigma's subscription-based pricing allows businesses to scale their usage according to their needs, providing flexibility and predictability in budgeting.
Moreover, the efficiency gains from using Sigma can lead to further cost savings. By enabling faster and more accurate data analysis, businesses can make better decisions, optimize operations, and ultimately improve their bottom line.
P&L Use Case
In this part of the blog, we will briefly discuss how we can create a P&L dashboard in Sigma:
Introduction to P&L Reports:
Profit and Loss (P&L) reports are essential for businesses to understand their financial performance over a specific period. These reports help in tracking revenues, costs, and profits, enabling better financial decision-making.
Creating a P&L Dashboard in Sigma:
- Connect to your data source: Ensure your financial data is available in a connected data source like Snowflake or BigQuery.
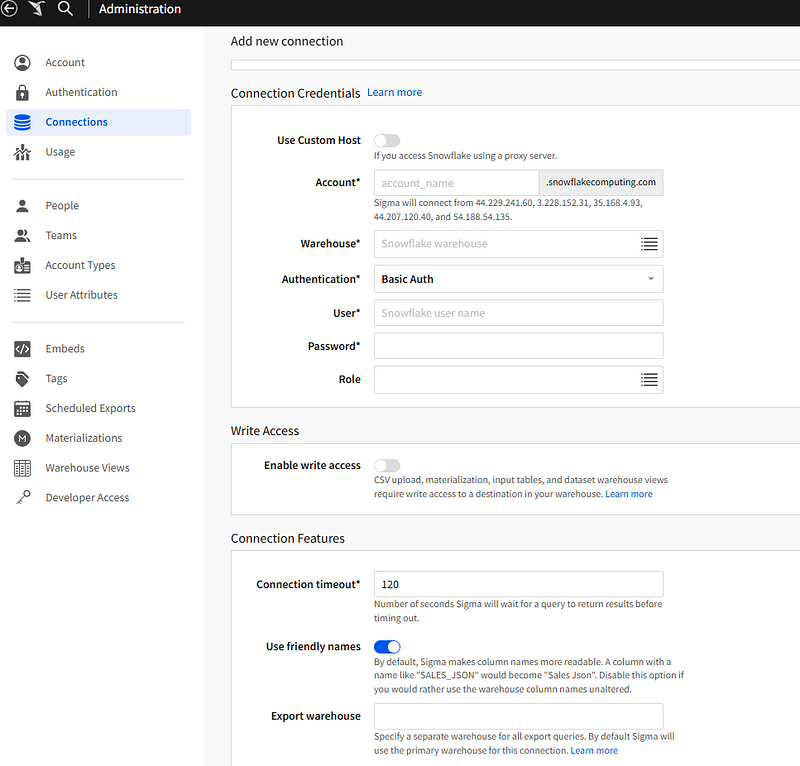
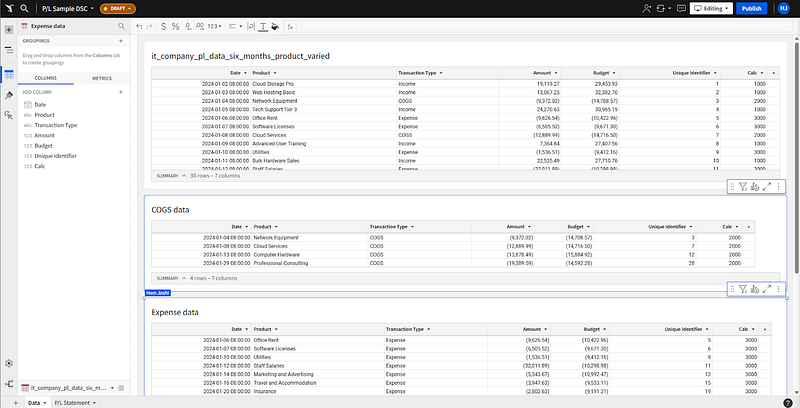
This is an example of what your data connection and raw data should look like:
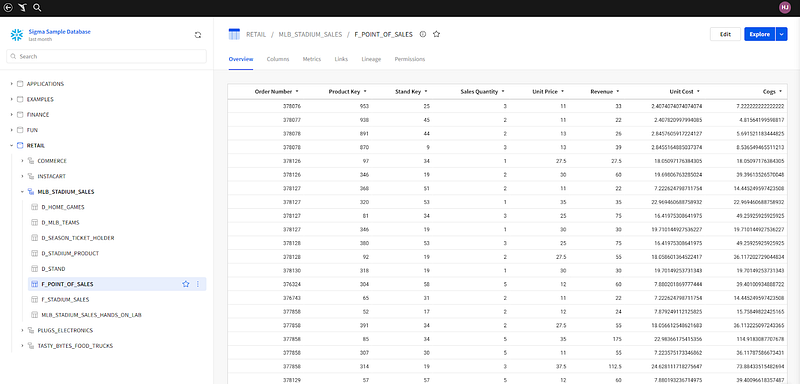
- Create a new workbook and import the data: Start a new workbook and import the relevant data tables. In the example below we are just importing a CSV for the ease of this demonstration.
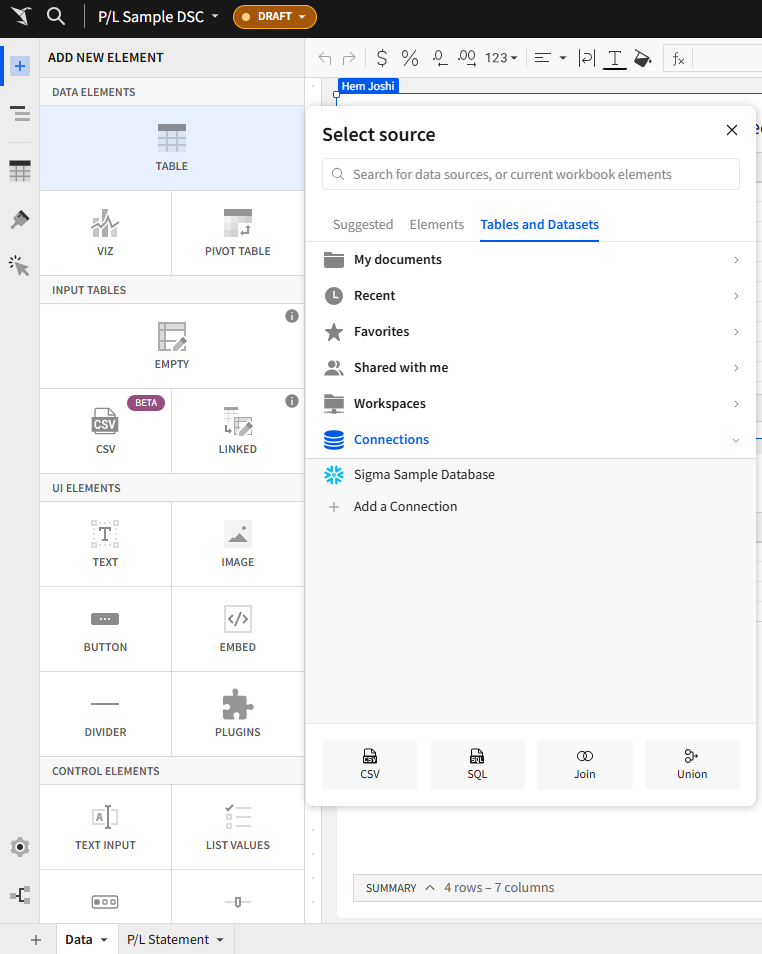
- Build the P&L report: Use Sigma's drag-and-drop interface to create a P&L report.
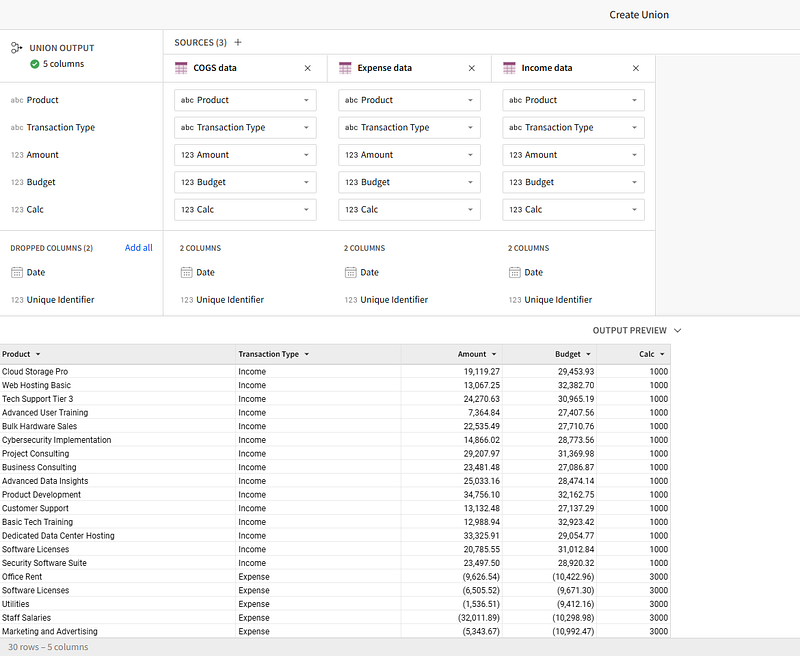
If you have multiple tables you can easily union these from right within Sigma!
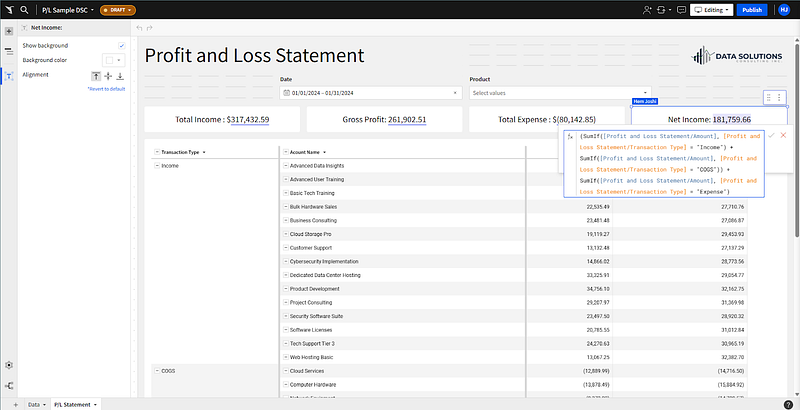
Include key metrics such as total revenue, total expenses, and net profit.
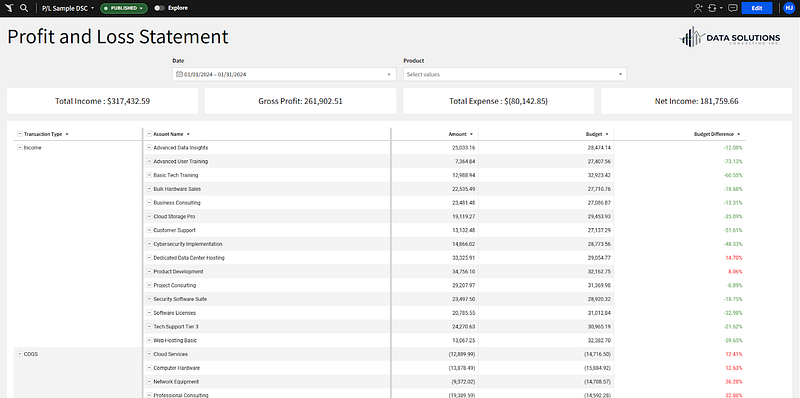
Sample Sigma Dashboard:
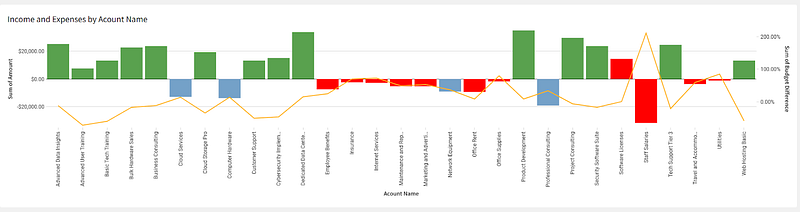
Here is an example of a P&L dashboard created in Sigma Computing. This dashboard includes various financial metrics and visualizations that provide a comprehensive view of the company's financial performance.
Conclusion
Sigma Computing stands out in the BI landscape for its ease of use, powerful features, and robust integration capabilities. Whether you're a small business or a large enterprise, Sigma offers a scalable and cost-effective solution for your data analysis needs. With its user-friendly interface and real-time data handling, Sigma Computing empowers users to make data-driven decisions efficiently and effectively. If you haven't tried Sigma Computing yet, now is the perfect time to explore its potential and transform the way you handle data.